Omic.ly Weekly 77
June 2, 2025
Hey There!
Thanks for spending part of your week with Omic.ly!
This Week's Headlines
1) The genetics of pregnancy loss
2) Proteins! Nom Nom Nom Nom.
3) The 2D structure of DNA was solved by someone you've probably never heard of before
4) Weekly Reading List
10-20% of pregnancies end in miscarriage. Genetics is helping us to explain why that is!
Pregnancy loss can be devastating to families and we’ve known for a while that there are multiple factors that can contribute to the loss of a fetus.
These can include maternal infection, chronic disease (diabetes, high blood pressure, obesity), structural abnormalities in the uterus, and hormonal problems.
But one of the biggest contributors to pregnancy loss is genetics.
We know that chromosomal aneuploidies (where extra chromosomes a present) can lead to miscarriages; however, the contribution of other genetic abnormalities to pregnancy loss is less well understood.
These abnormalities can include novel combinations of small sequence variants carried by each parent that lead to disease, non-disjunction of chromosomes (chromosomes don’t separate during meiosis), de novo mutations (mutations not carried by either parent) that occur during the formation of gametes (sperm and eggs), or even errors that occur during chromosome recombination (deletions, duplications, translocations, and inversions).
Recombination itself is an important evolutionary adaptation that allows for the mixing of a genome to create the diversity required for a species to survive in a changing environment.
This is much less important now as we’ve developed into an advanced species with things like houses and healthcare, but understanding how genetic changes continue to impact our health and ability to reproduce has major societal impacts.
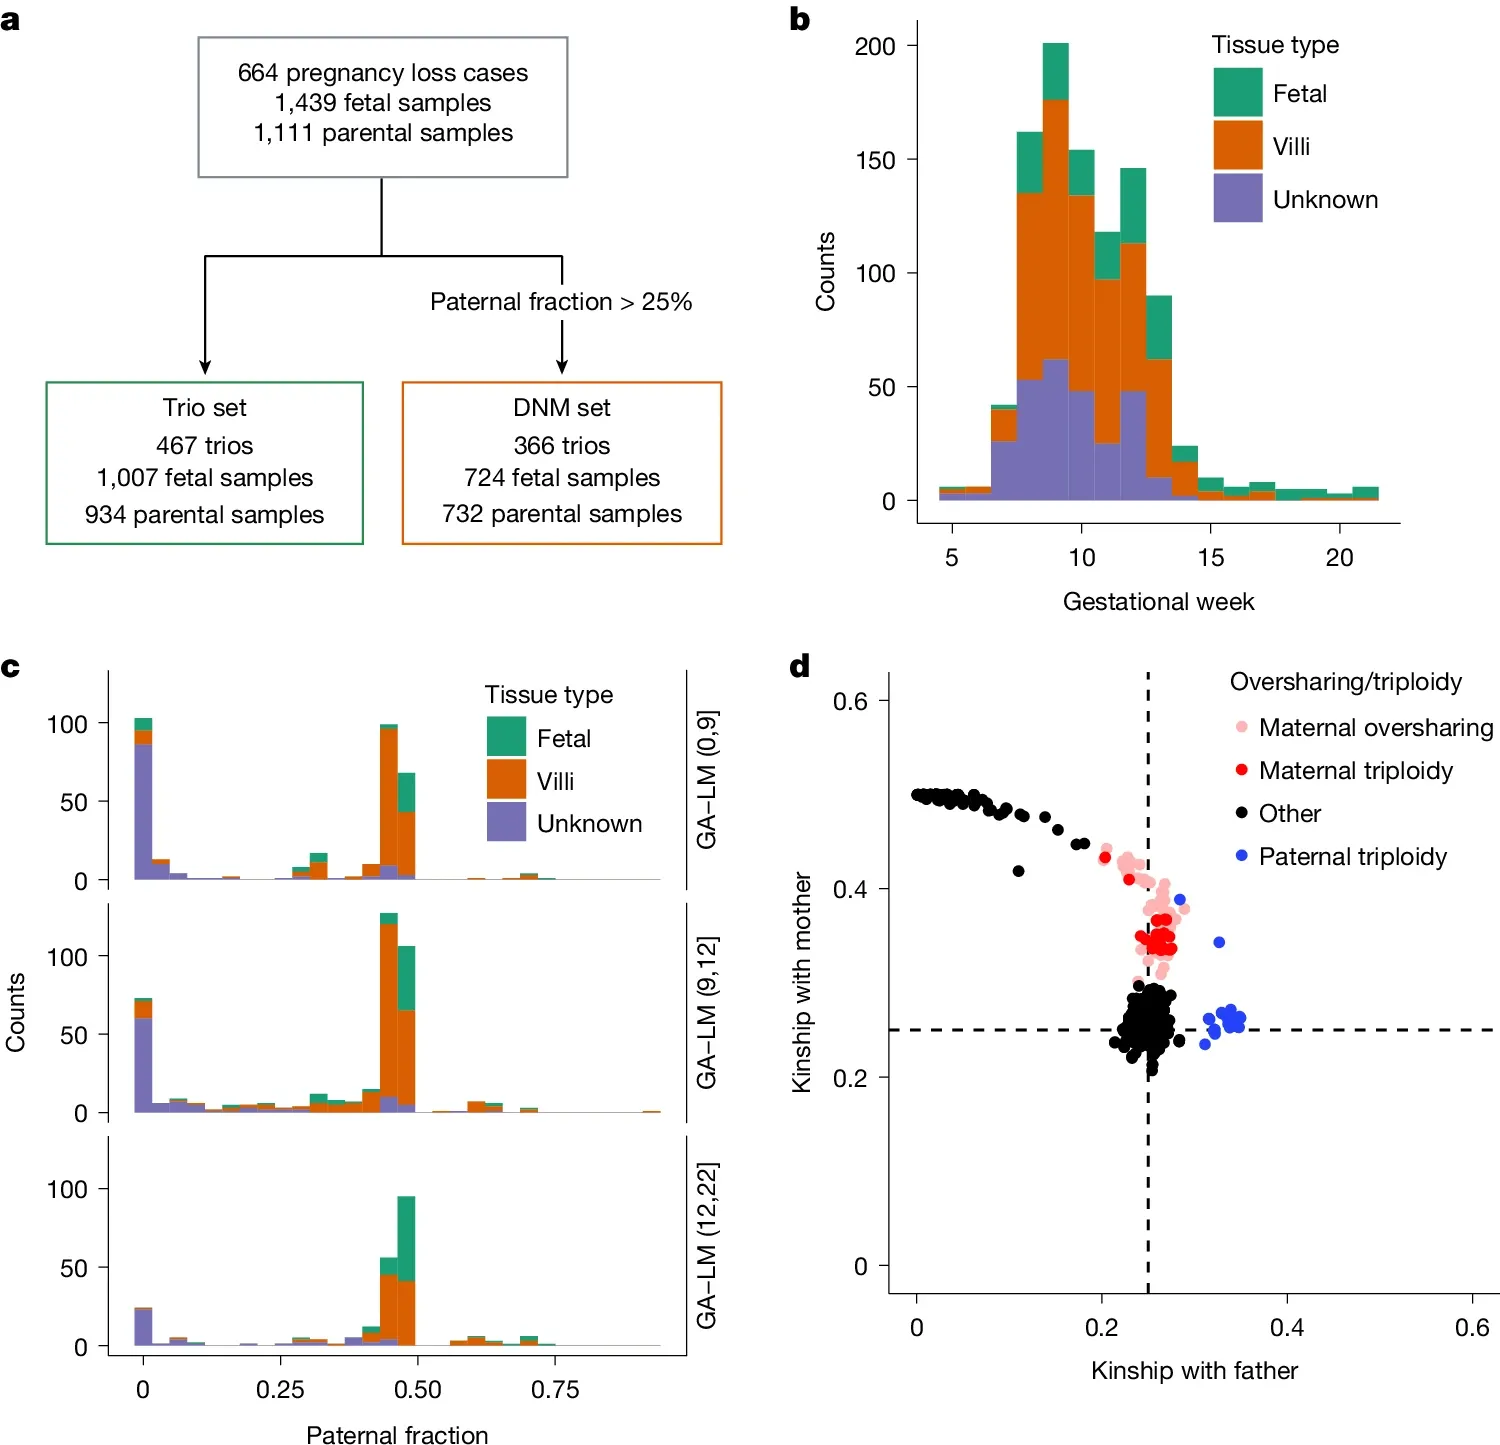
Studying these changes was the focus of the Copenhagen Pregnancy Loss (COPL) Study which recently published their results in Nature.
They performed short-read whole genome sequencing on 467 trios (fetus, mother, father) to identify genetic abnormalities that might explain early embryonic demise.
The figure above is an overview of the study and sample set. a) is a flowchart of the study, b) shows the gestational age of the samples before loss, c) is the paternal fraction observed (a measure of maternal cell contamination), indicating that this sample set showed maternal cell contamination and d) is a similar plot showing relatedness to the father highlighting a skew toward maternal genetics (a combination of contamination and the fact that some of these samples were maternal triploidies - 2 copies of mom + 1 copy of dad).
This study found that 55% of pregnancy loss cases could be explained genetically:
44.1% by aneuploidy
6.4% by triploidy
3.3% by pathogenic small sequence variants
1.3% by de novo copy number variants
They also saw that the maternal genome contributed most frequently to these abnormalities, which is consistent with meiotic errors during oogenesis.
However, euploid (the correct number of chromosomes) fetuses without structural anomalies still showed a significant burden of pathogenic mutations.
Further, the study estimated that 1 in 136 pregnancies could be lost due to pathogenic small sequence variants, underscoring the need to look beyond chromosomal abnormalities in pregnancy loss cases.
###
Arnadottir GA, et al. 2025. Sequence diversity lost in early pregnancy. Nature. DOI: 10.1038/s41586-025-09031-w
Single-cell and spatial proteomics - a more refined future.
Proteomics is the study of all of the proteins produced by our cells.
This includes how they interact with one another and how all of those proteins collaborate to create the numerous tissues that make up multicellular organisms!
But, proteomics has the same exact problem that most omics approaches have as it relates to how we collect and analyze samples.
Until recently, omics studies were done on bulk material, meaning we collect a blood sample or take a tissue biopsy and then grind up all of those cells.
We then throw them on an instrument to detect everything that’s in there.
The problem with this approach is that blood (and tissues) contain many millions of cells and not all of them are the same!
What happens when you measure a sample in bulk is that all of those cells and the proteins/RNA/DNA in them get mixed with all of those things from the other cells in the sample.
This has the effect of averaging out all of the signals, meaning, you’re likely only going to be able to detect big changes within the population of cells you sampled!
Unfortunately, you might be really interested in small changes, or changes that happen gradually over time.
Because, it’s the activities of individual cells working together (but differently) that makes us who we are!
It’s also small populations of misbehaving cells in things like cancer that can cause big problems later, and it’d be super nice to detect those signals sooner rather than later!
Wouldn’t it be swell if we could do proteomics on individual cells?
Thankfully, we’re in luck!
The explosion of the field of single-cell and spatial transcriptomics (looking at RNA) has also led to methods that allow us to look at proteins at the same time.
You might be wondering why we'd care about proteins if we’re already able to look at RNA.
And that’s because RNA expression doesn’t always correlate directly with protein abundance!
So, you can have lots of an mRNA in a cell, and a little of its translated protein, or vice versa depending on what a cell is doing at any given time!
This means that the two techniques are very complementary, and if you’re already doing transcriptomics, most methods allow you to throw in a bunch (50-100) of antibodies to also detect proteins you might be interested in.
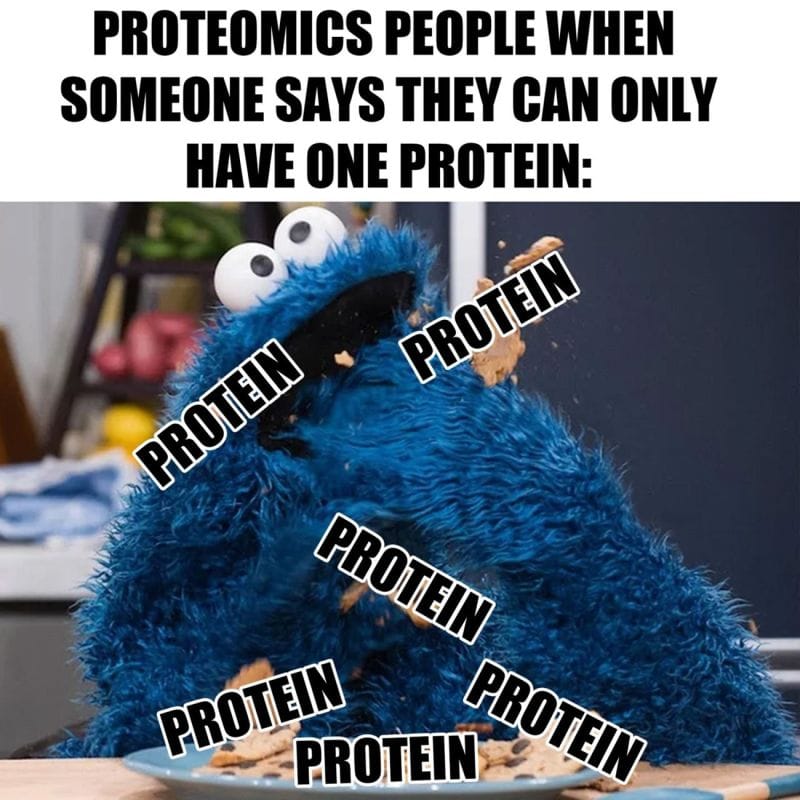
But, what if you want to GET ALL OF THE PROTEINS?!?!?!
If you’re a proteomics Cookie Monster, you’re also in luck!
We also have LCMS based methods that take an unbiased approach to protein detection.
And when paired with fancy new separation and capture techniques, we can use LCMS to detect and quantify all of the proteins in single cells or within a tissue section.
While these techniques are still in the earliest stages of development, they offer the promise of a more precise future for increasing our understanding of the biology behind health and disease!
Watson and Crick were the first to describe the structure of the DNA double helix. Their major contribution to science was, at its core, a synthesis of all of the best data available at the time.
This statement isn’t meant to discount what they did in 1953, but more so to recognize all of the foundational work that preceded them.
1869 - Nuclein (DNA) is discovered - F. Miescher
1912 - The hydrogen bond is proposed - T. S. Moore and T. F. Winmill, Popularized by L. Pauling
1935 - DNA is a macromolecule with a sugar phosphate backbone - P. Levene
1943, 1952 - DNA is the genetic material - Avery-MacLeod-McCarthy, Hershey-Chase
1950 - A and T, G and C are in a 1:1 ratio - E. Chargaff
1952 - DNA is a double helix - Rosalind Franklin, Raymond Gosling
1953 - Watson-Crick base pairing - Broomhead, Donahue, Watson, Crick
While all of these pieces were required for the final structure to be determined, the bulk of the basic chemistry was done between 1905 and 1935.
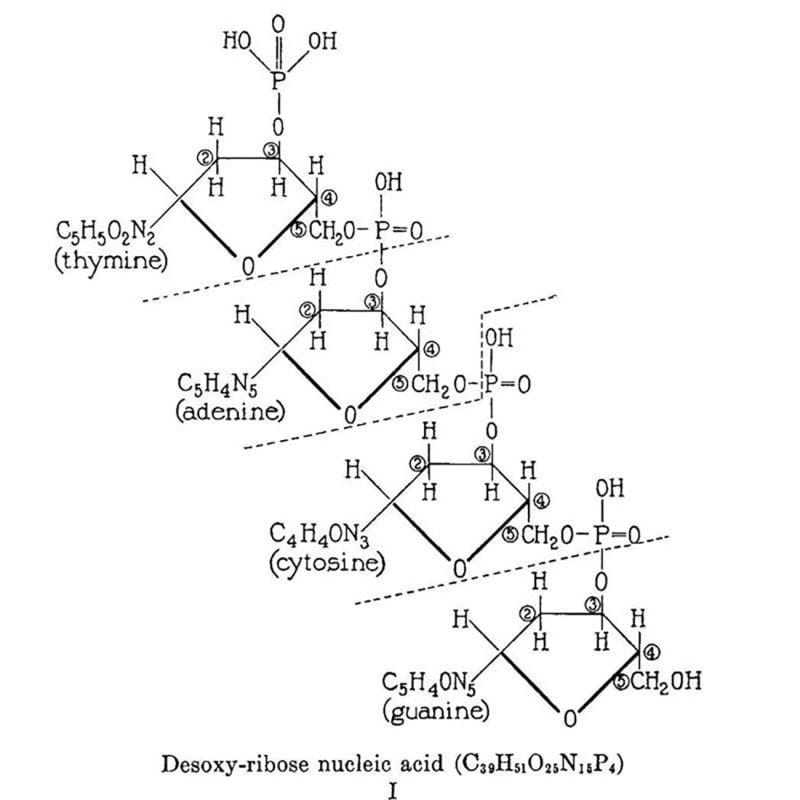
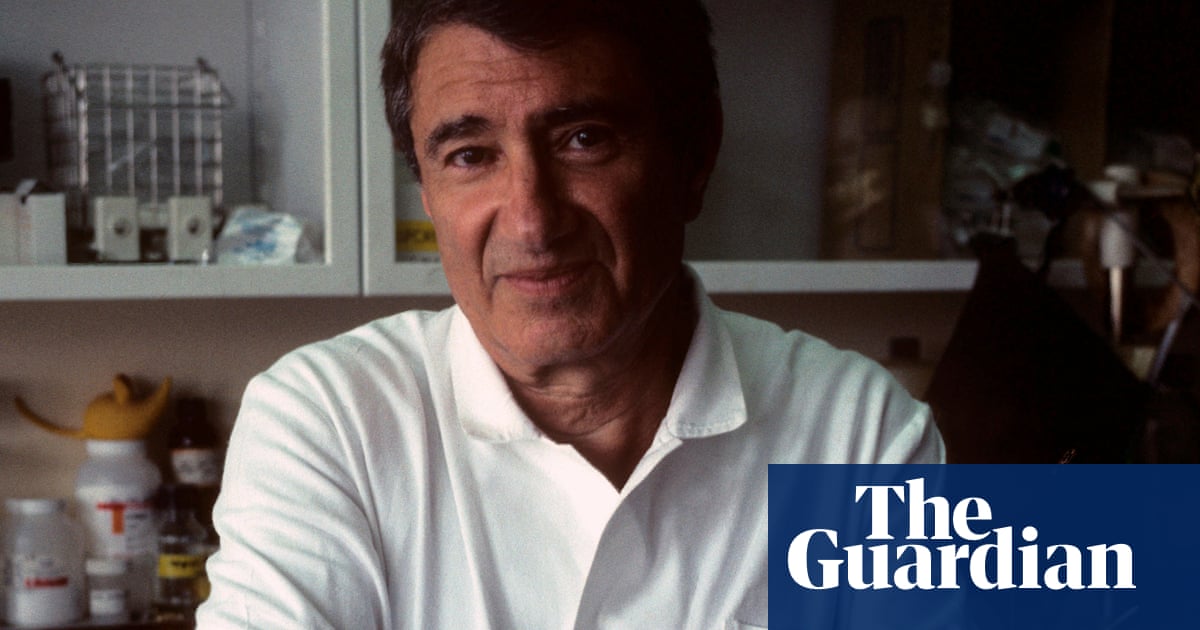
The structure above is the culmination of the life’s work of Phoebus Levene.
He's probably not someone you’ve heard of before.
He was the first to discover that nucleic acids are composed of ribose sugars.
He also determined that these sugars were connected by a phosphate backbone.
And, he eventually figured out that DNA is made of 2-deoxy-D-ribose while RNA is D-ribose.
Oh, he also confirmed the identities of all of the bases: Adenine, Thymine, Guanine, Cytosine and Uracil.
And he's the reason why we call these bases nucleotides!
Pretty mind blowing, right?
This work is summarized in the figure above which displays Levene's 2 dimensional chemical structure for 'Desoxy-ribose nucleic acid.' This structure isn't perfect (Cytosine is labeled as a diphosphate and the chemical composition of the nucleobases is a little off) but it does accurately depict the 5'-3' sugar phosphate backbone of DNA.
Now, the reason why you've never heard of Levene is because he proposed the 'tetranucleotide hypothesis' which stated that DNA was merely a structural molecule composed of 4 repeating nucleotides.
He was certain this meant DNA was too simple to be the carrier of genetic information.
Like everyone else, he believed that proteins were the obvious choice as the genetic material since there are 5 times as many amino acids.
Unfortunately, Levene's hypothesis took the spotlight off of DNA for decades and this has been described as a 'scientific catastrophe' despite Levene getting the basic chemistry and the 2D structure of DNA mostly correct.
So, for Watson and Crick to finally put the 3D puzzle together it took a renewed interest in DNA as the genetic material, Levene's chemistry, the ratio of the bases from Chargaff, (borrowed?) X-ray diffraction data from Franklin, and a couple pints at the Eagle pub in Cambridge.
The rest is (a very disputed) history.
###
Levene PA, Tipson RS. 1935. The ring structure of thymidine. JBC. DOI:10.1016/S0021-9258(18)75193-4
Weekly Reading List


Were you forwarded this newsletter?
LOVE IT.
If you liked what you read, consider signing up for your own subscription here: