Thanks for spending part of your week with Omic.ly!
This Week's Headlines
1) No sequencer needed: Imaging based single-cell multiomics
2) Microbiomes are complicated and if you want to understand them you better start with good data
3) What did Watson and Crick actually discover?
4) Weekly Reading List
STAMP brings us non-destructive single-cell profiling without the sequencing
Single-cell transcriptomic profiling has emerged in recent years as a powerful tool for understanding the biology of complex cellular mixtures and tissues.
It's been used extensively to look at how cells respond to changing environments, tease apart the dynamics of disease states, and track cell fates during development.
And looking at single-cells is important because the activities of cell populations or rare individual cells can get washed out in bulk measurements of cellular material.
So, understanding the role that individual cells play in development, the function of a tissue, or even the development of cancer can be really important!
Unfortunately, one of the biggest challenges facing the field of single-cell transcriptomics is that it's very expensive and requires a ton of sequencing to get useful information out of each cell.
The methods for isolating cells can also be technically challenging, influence what genes are expressed or even bias the results against specific cell populations that are hard to isolate.
The go-to methods in single-cell fall into four broad categories:
Flow Assisted Cell Sorting - A cell sorter is used to separate single cells and spit them out individually into a microtiter plate
Droplet-based Microfluidics - single cells are encapsulated in an oil droplet with reagents that lyse the cell and barcode the contents for sequencing
Microwells - Cells are distributed across wells of a microplate with the hope that each well only ends up getting a single cell
Combinatorial Barcoding - Cells are combined across multiple plates each containing unique barcodes - new barcodes are ligated after each move which results in each cell ending up with a unique barcode!
But what ALL of these methods have in common is that they end up destroying the cells and turning them into sequencing libraries.
This means those cells can't be used for any other downstream analyses like proteomic profiling.
It also means you're probably going to spend a lot of money sequencing these things!
But as single-cell studies have increased in popularity, so have spatial studies!
These two things are related but different, in single-cell you're isolating and looking at...single-cells - in spatial, you're usually looking at where transcripts and proteins are located in tissue sections on slides.
Most of the latest generation of spatial techniques use imaging to locate transcripts and antibody bound proteins which makes them a bit cheaper because they don't require sequencing AND they have the added benefit that the tissue sections are not destroyed during the different analyses.
Now, some smart people have realized that you can use these spatial imaging systems to also look at single-cells!
They've developed something called Single-Cell Transcriptomics Analysis and Multimodal Profiling (STAMP) and basically what's done here is that single-cell suspensions are fixed and permeabilized using formaldehyde, bound to a microscope slide, and then processed like they're any old tissue sample going into the spatial imaging process!
It's one of those things that's so simple and cool it makes you wonder why it took people so long to figure out this was possible!
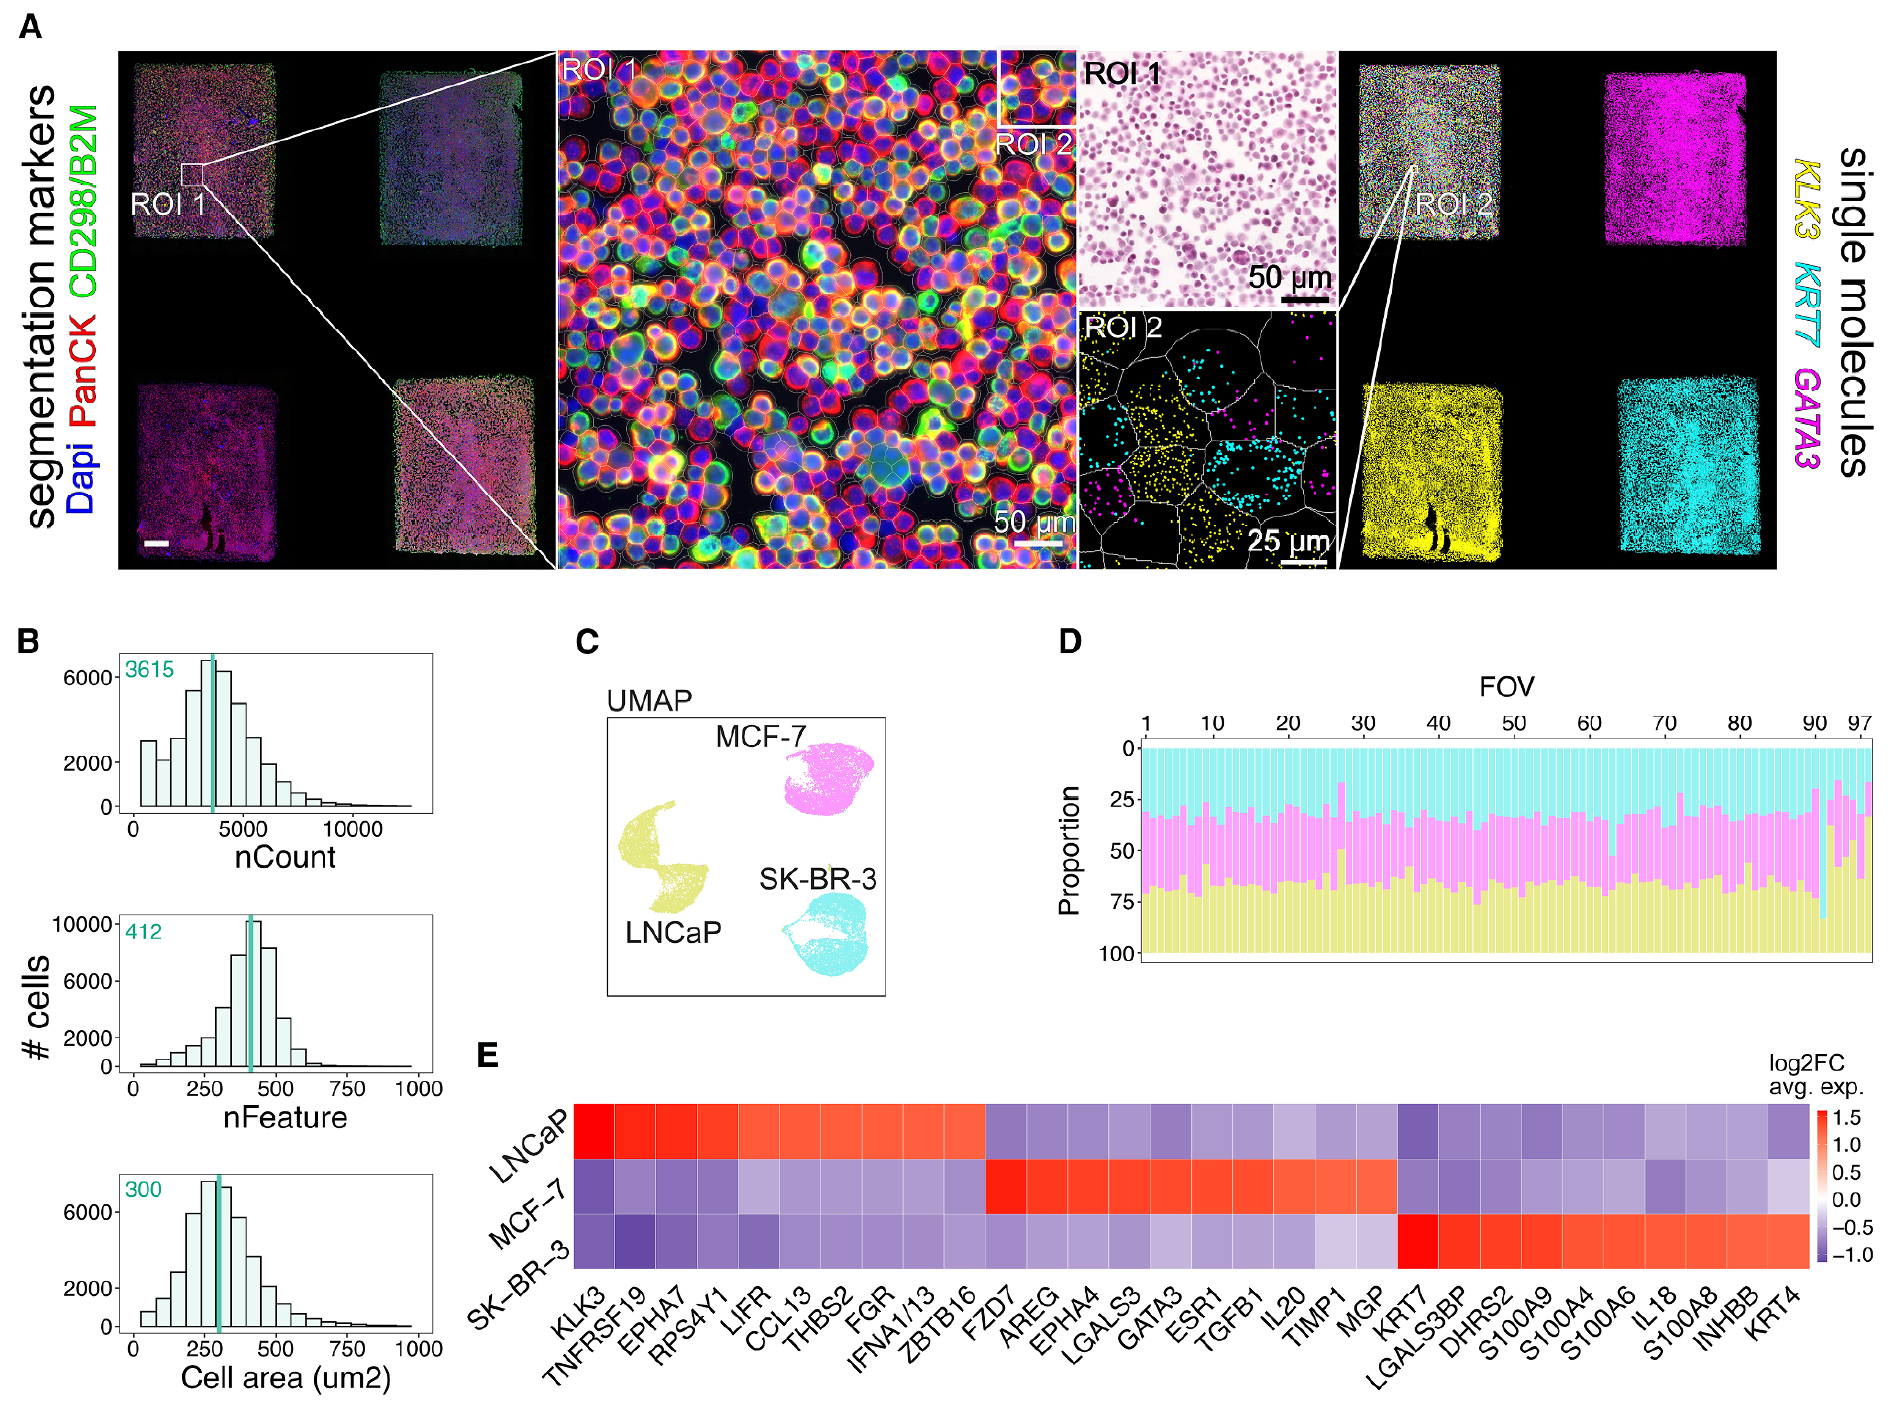
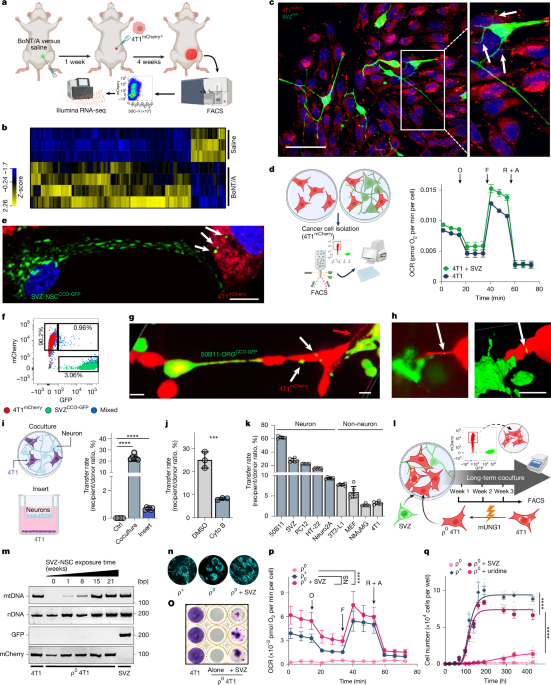
The results of this work can be seen in the figure above where a STAMP experiment was carried out with a 3-way mixture of MCF-7, LNCaP, and SK-BR-3 cancer cells on the CosMx platform.
A) shows the cell segmentation and transcript detection analysis, B) highlights that they get a lot of data from a lot of cells, and C,D,E) show they're able to easily discriminate the cells within the mixture!
They go on to show that they can detect a single MCF-7 cell in mixtures of millions of cells (1:100,000, 1:50,000) which highlights the impressive sensitivity of the technique for profiling things like circulating tumor cells in blood samples.
But the coolness doesn't stop there, because this technique is non-destructive so you can also do spatial proteomic profiling or analyze the samples across multiple different instruments.
The authors estimate that this technique will end up costing about $0.003 per cell which is kind of mindblowing when the average cost for a traditional sequencing based single-cell experiment is in the $0.10 range.
Now, there are drawbacks such as this technique doesn't produce full length transcripts so if you're into that you'll have to stick with the sequencing based techniques!
But STAMP looks like an interesting (and cheap) option for doing single-cell proteo-transcriptomics on a budget!
###
Pitino E, et al. 2025. STAMP: Single-cell transcriptomics analysis and multimodal profiling through imaging. Cell. DOI: 10.1016/j.cell.2025.05.027
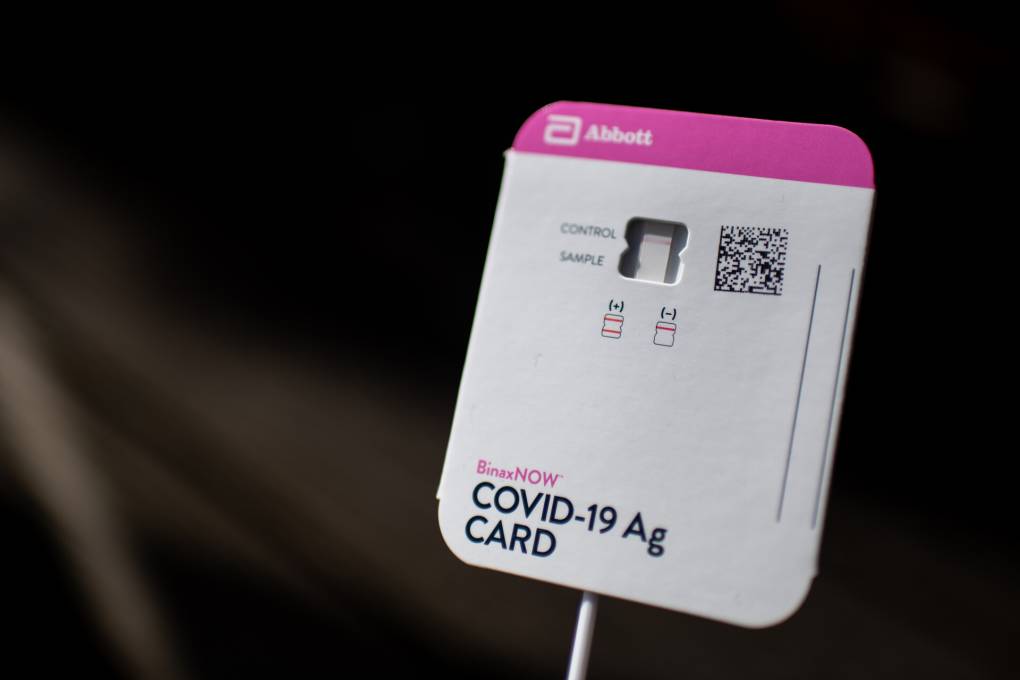
So, you want to learn more about your microbiome?
Cool, here's what you need to know!
The human microbiome is the entire community of microorganisms that live on or in your body and is made up of bacteria, fungi and viruses.
Your body contains, or has on it, many different microbiomes.
This is because each crack, crevice, surface, and orifice creates a distinct environmental niche that promotes the growth of totally different microorganisms!
Meaning, your skin, your mouth, your armpits, and your gut have different microbiomes.
But it doesn't stop there, your gut microbiome itself can be segmented into different microbiomes because your upper and lower gastrointestinal tract create completely different environments.
So If you want to learn about your microbiome, you need to pick one, or choose a service that gives you multiple swabs to test them all!
Well, all except your upper GI, that one's a bit tough to do yourself, even if you have a reeallly long swab.
Once you've settled on which one you want to test you need to pick a service provider.
This is a pretty crowded space but I'm going to let you in on a little secret.
Most of these tests are actually just a resold product from a handful of vendors who provide 'white label' services, so you're mostly getting the same thing from everyone.
And what you're generally getting is a read-out of your microbial community based on 16s ribosomal sequencing.
Now, only bacteria contain a 16s gene so the vast majority of services aren't really reporting out a true microbiome because they're missing all the fungi and viruses!
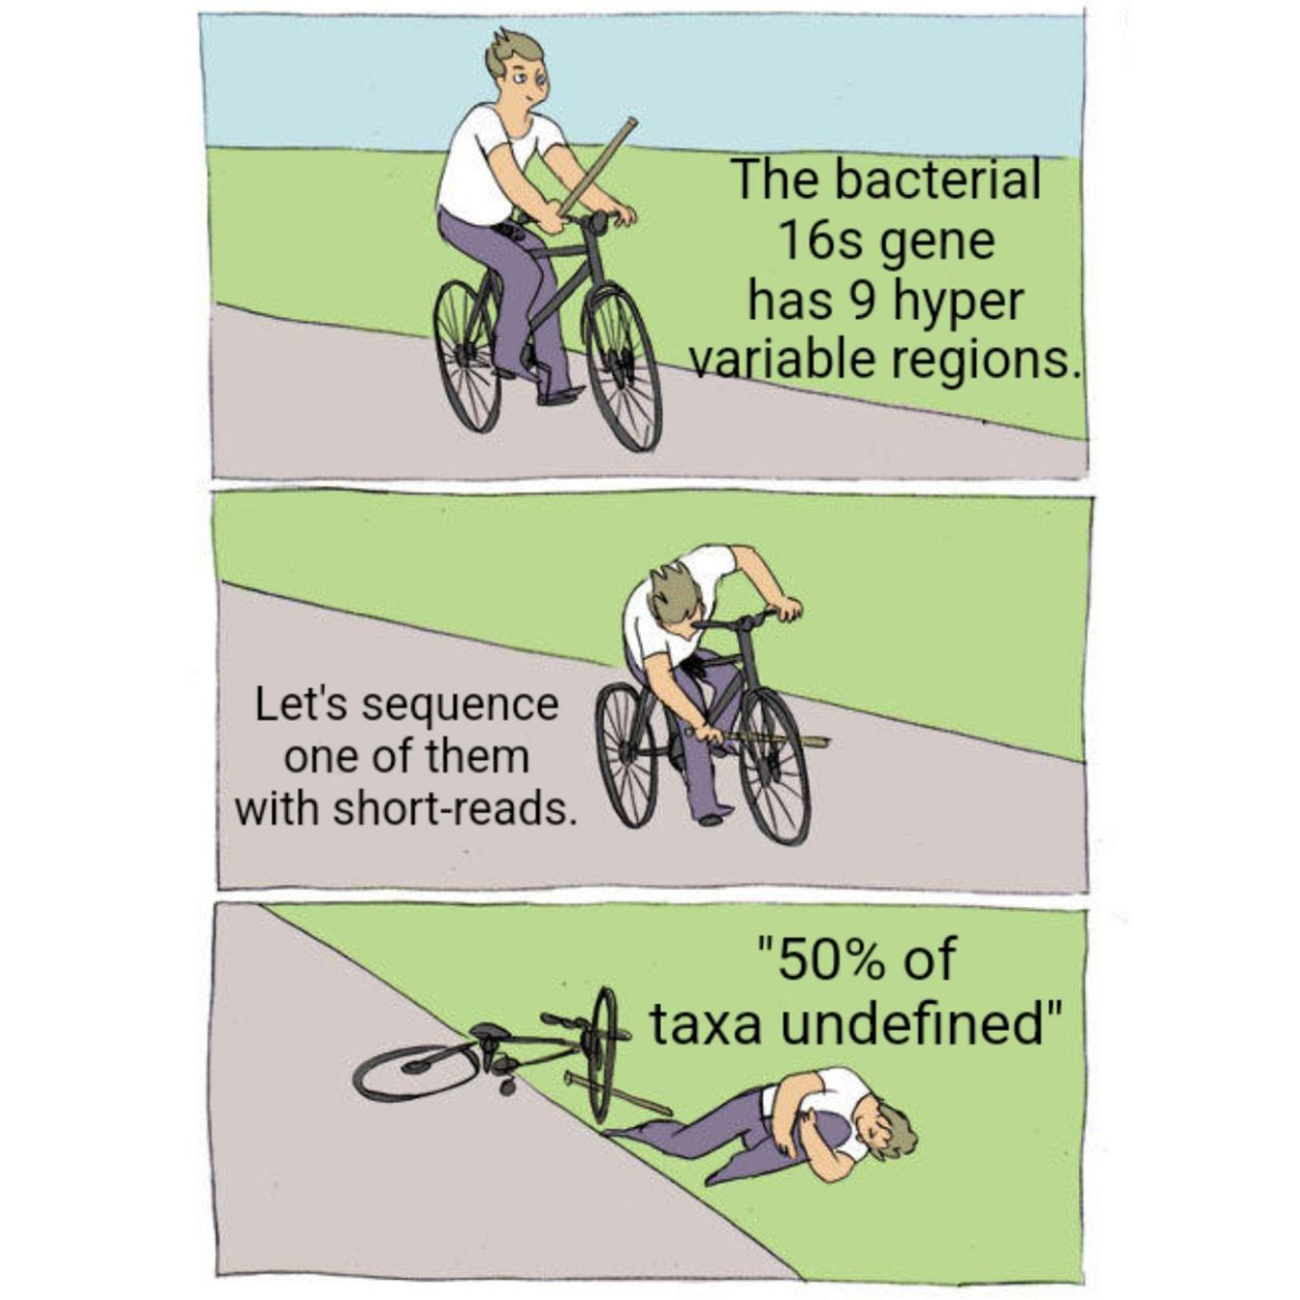
But to make matters worse, most of these services only sequence a small fraction of the 16s gene, the V4 hypervariable region.
You might be thinking, 'hypervariable sounds good!'
Except the 16s gene is 1600 bases long and has 9 hypervariable regions...
Sequencing just one of them is not going to give you the most accurate representation of your community.
And if you really want to do this right, you'd do 16s-ITS-23s.
Except you can't sequence that unless you use **drum roll** long-reads because it's ~4,500bp!
Microbiome sequencing is yet another example of a situation where 'friends don't let friends short-read,' especially if you actually care about identifying species or subspecies level community composition.
There are products that claim they can get species level descrimination from just V4.
But don't be fooled!
While they can detect about 50% of species with just V4, you really need all 9 hypervariable regions to get a species level identification for all of the taxa in a sample.
Otherwise, the best you can do is a genus level identification.
So, what do you actually get out of doing a direct to consumer microbiome analysis?
That's a good question.
There's general agreement that the microbiome is important, but what we can actually learn by sequencing it, other than saying there's some bacteria there, is still a work in progress.
History is written by victors, and that statement couldn't be more true than it is in the case of Watson and Crick's 'discovery' of the DNA double helix.
Their structure was published in the April 1953 issue of Nature along with two other papers on the same topic from Wilkins and Rosalind Franklin.
Although they don't cite Franklin in their 1953 paper, they definitely used her data.
It was Franklin's paper that included Raymond Gosling's pristine diffraction of B-DNA, known as Photo 51, that showed the structure of DNA is helical, it's double stranded, and the bases faced inward with the phosphate backbone on the outside.
While this is a good chunk of what you need to know to put the structure of DNA together, there were a couple of additional missing pieces that the boys from the Cavendish Lab had to source.
What gets lost in all of the popular coverage of this discovery is that Watson and Crick didn't perform any experiments, they aggregated the best science at the time to create their model.
Franklin wasn't the only person they borrowed from.
Phoebus Levene's life was spent studying DNA, he's why we call the bases nucleotides and he showed that DNA has a 5'-3' deoxyribose sugar phosphate backbone but also that the bases are composed of adenine, thymine, guanine, and cytosine.
Erwin Chargaff shared with them what he knew about the ratios of the bases, or Chargaff's rule, which is that A and T, and G and C are found paired in a 1:1 ratio.
He had a famously checkered opinion of the duo and even went as far as to say, "I told them all I knew. If they had heard before about the pairing rules, they concealed it. But as they did not seem to know much about anything, I was not unduly surprised."
Next on the list was hydrogen bonding between the bases. This little known fact was cribbed from the thesis work of a graduate student at the time, June Broomhead (Lindsey), who also proposed all of the possible structures for A, T, G and C.
But knowledge of that final piece of the puzzle came from Jerry Donohue who shared an office at Cambridge with Crick.
He noticed that Crick was trying to pair up the bases using their 'enol' forms and so Donohue suggested, based on Broomhead's work, that Crick should try to smash the 'keto' forms together instead because they were much more common.
The figure above is Crick's smashing result: Watson-Crick(-Broomhead-Donohue?) base-pairing. It was published in 1954 in a much longer and more detailed follow-up paper on the structure of DNA.
While historic, this story is nuanced, and I'll leave you with Crick's measured interpretation of the situation.
"What, then, do Jim Watson and I deserve credit for? The major credit I think [we] deserve … is for selecting the right problem and sticking to it."
I tend to agree.
###
Crick FHC, Watson JD. 1954. The Complementary Structure of Deoxyribonucleic Acid. Proc. R. Soc. A. DOI:10.1098/rspa.1954.0101